汇总 snakefood、pydeps、pipdeptree、Pyan3、pycallgraph 等依赖与调用分析工具。
导航
收录来源
raw/langs/pythons/tools/code_analysis.rstraw/langs/pythons/tools/code_analysis/snakefood.rstraw/langs/pythons/tools/code_analysis/pydeps.rstraw/langs/pythons/tools/code_analysis/pipdeptree.rstraw/langs/pythons/tools/code_analysis/Pyan3.rstraw/langs/pythons/tools/code_analysis/pycallgraph.rst
条目内容
snakefood
- Python Dependency Graphs
- GitHub: https://github.com/blais/snakefood
Warning
不建议使用
Note
Need Python 2.7 or higher. Python-3.x is NOT supported
pydeps-生成依赖图
Note
这个工具好用
安装 pydeps:
pip install pydeps

注:
    需求先安装 graphviz 保证 dot 命令可用
生成依赖图:
pydeps /path/to/your/project
选项
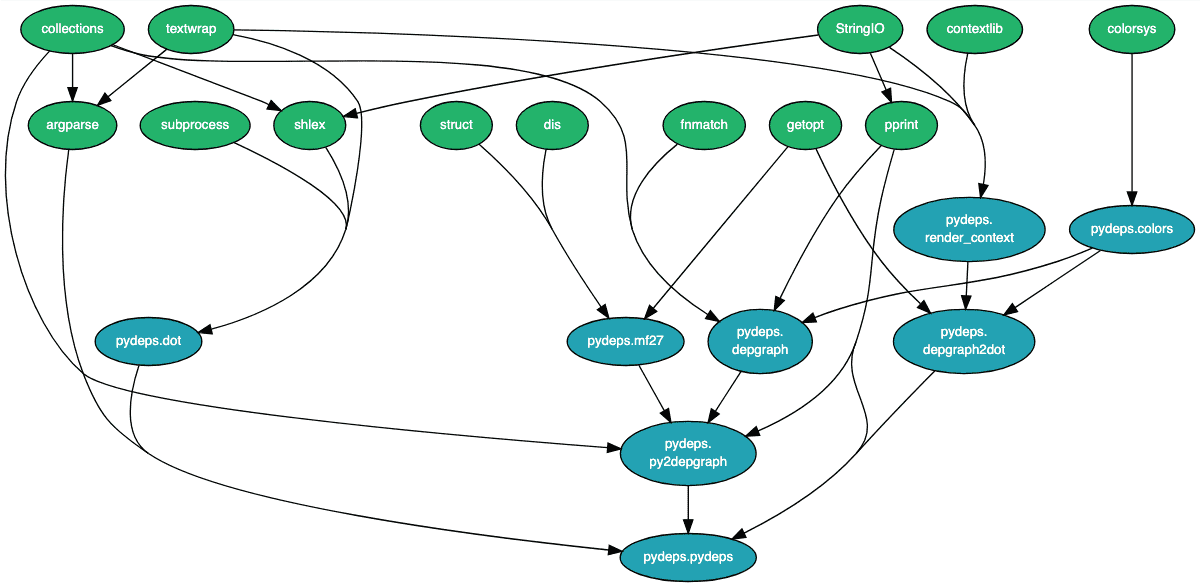
—max-bacon
# --max-bacon: 指定培根数(默认2)
# --max-bacon=0 (infinite)
shell> pydeps pydeps --show --max-bacon 2 --pylib -x os re types _\* enum
—cluster
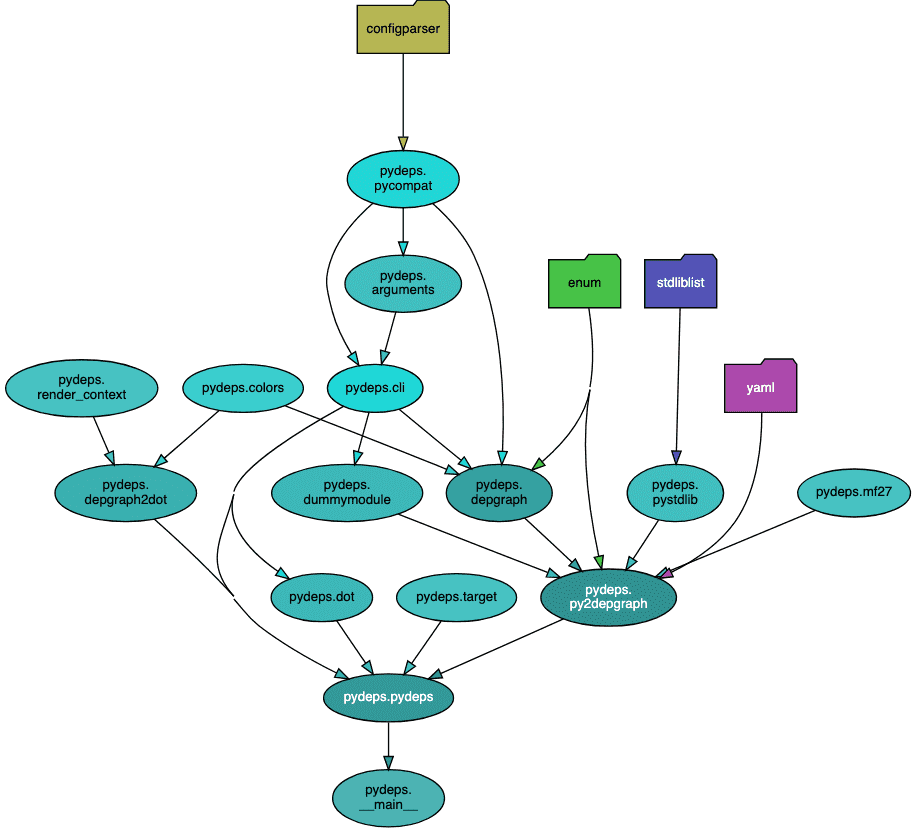
# --cluster: collapse external modules into folder-shaped objects
# 如果你对外部模块的内部结构不感兴趣,你可以添加 --cluster 标志,它将外部模块折叠成文件夹形状的对象
shell> pydeps pydeps --max-bacon=4 --cluster
—max-cluster-size=N
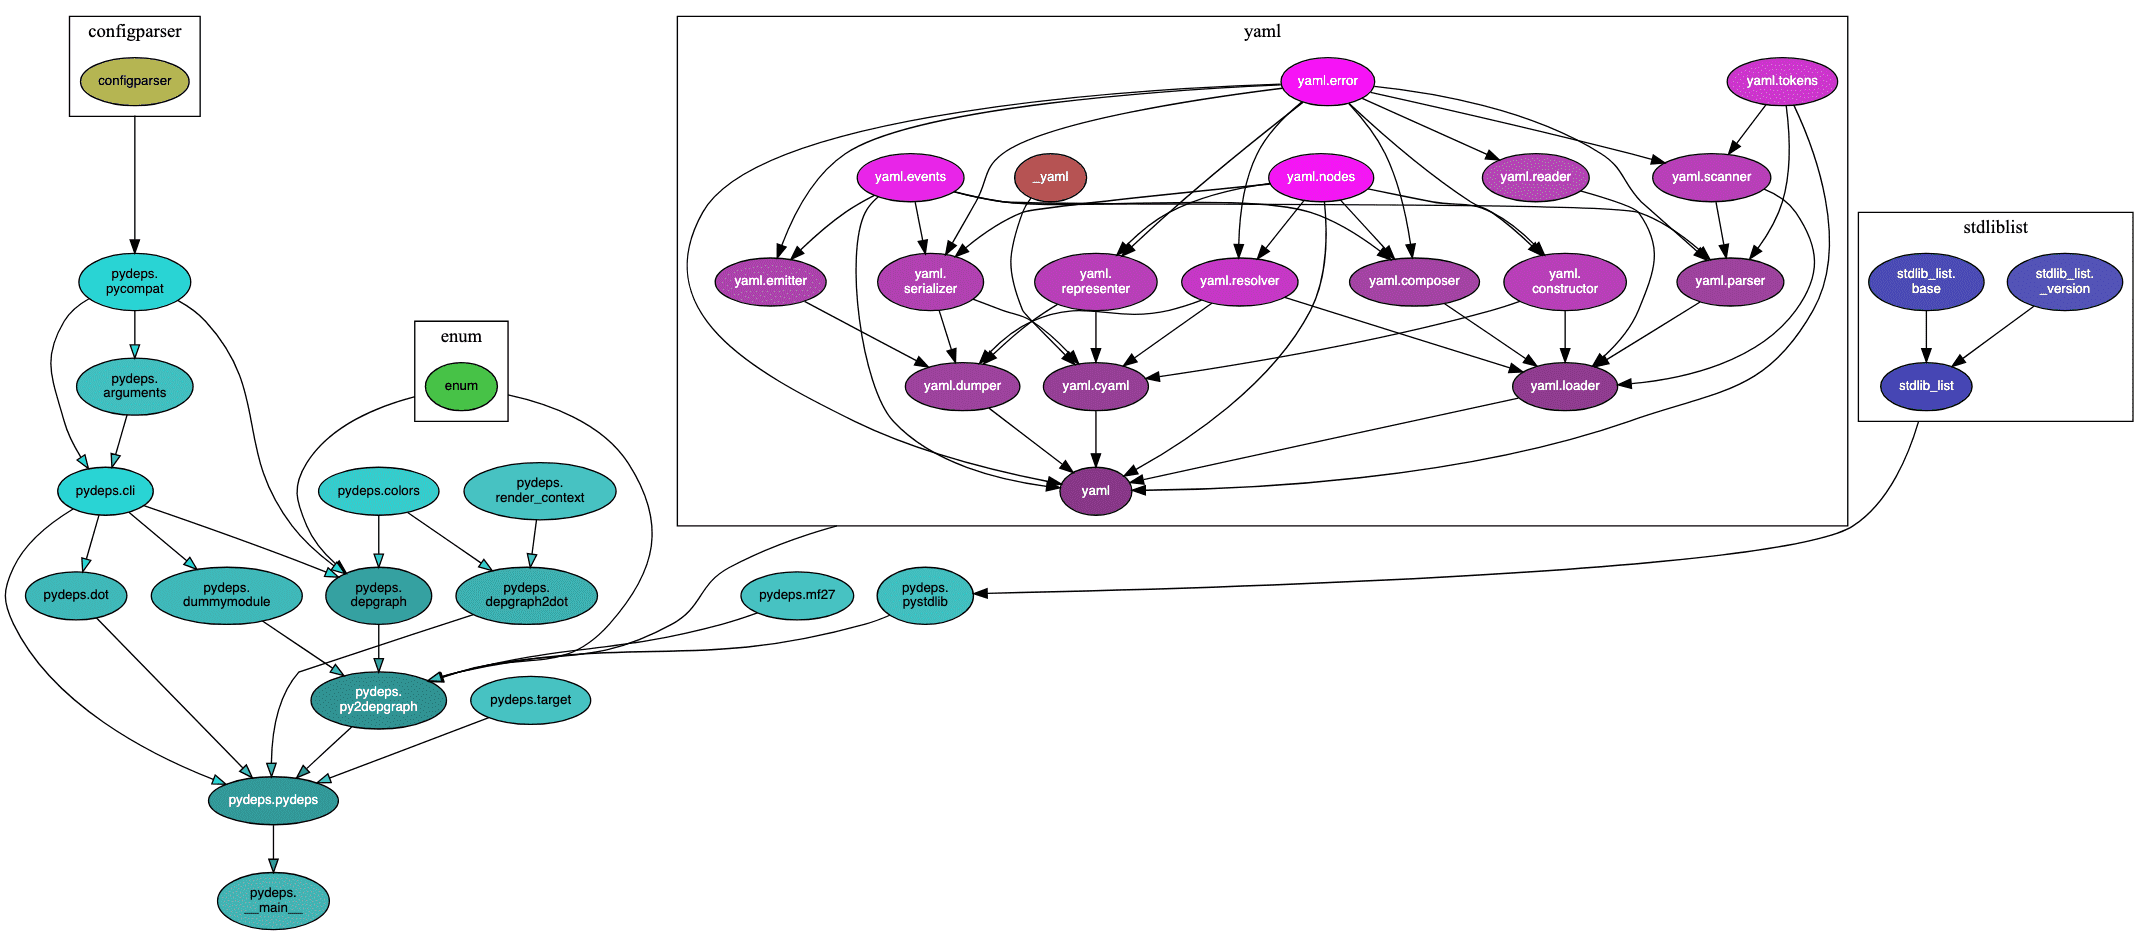
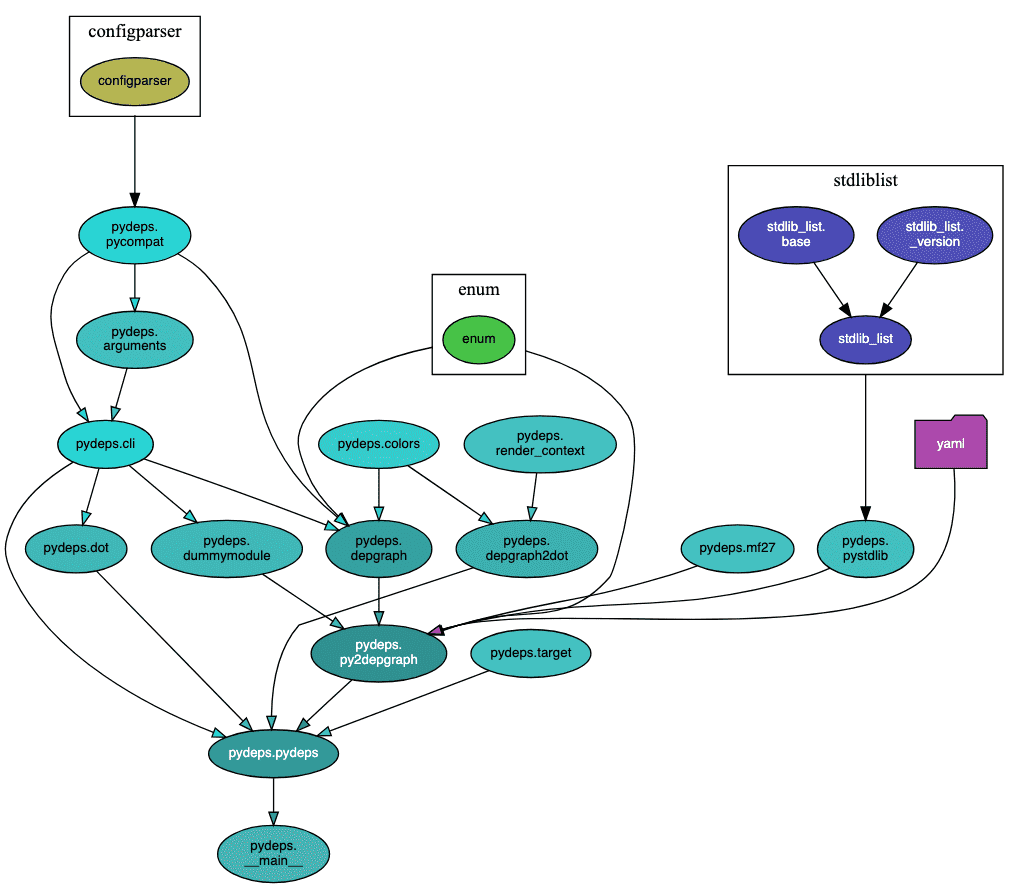
# --max-cluster-size: controls how many nodes can be in a cluster before it is collapsed to a folder icon
# 要查看内部结构并描绘外部模块,请使用 --max-cluster-size 标志,该标志控制在折叠为文件夹图标之前集群中可以有多少个节点
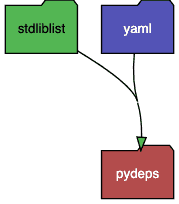
指定较大的 --max-cluster-size 就会把 yaml 内部结构展示出来:
shell> pydeps pydeps --max-bacon=4 --cluster --max-cluster-size=1000
指定较小的 --max-cluster-size 就会把大于3的 yaml 缩成一个文件夹:
shell> pydeps pydeps --max-bacon=4 --cluster --max-cluster-size=3
—min-cluster-size=N
# --min-cluster-size: remove clusters with too few nodes
—rmprefix xxxx
# --rmprefix pydeps.: 在显示的图表里面不显示 `pydeps.`
—max-module-depth=N
# --max-module-depth:
# 标志检查包的内部依赖关系,同时限制模块深度
shell> pydeps pandas --only pandas --max-module-depth=2 -x pandas._\* pandas.test\* pandas.conftest
—rankdir
# Graph direction
# 指定显示方向
Top to bottom (default):
shell> pydeps pydeps --rankdir TB
Bottom to top:
shell> pydeps pydeps --rankdir BT
Left to right:
shell> pydeps pydeps --rankdir LR
Right to left:
shell> pydeps pydeps --rankdir RL
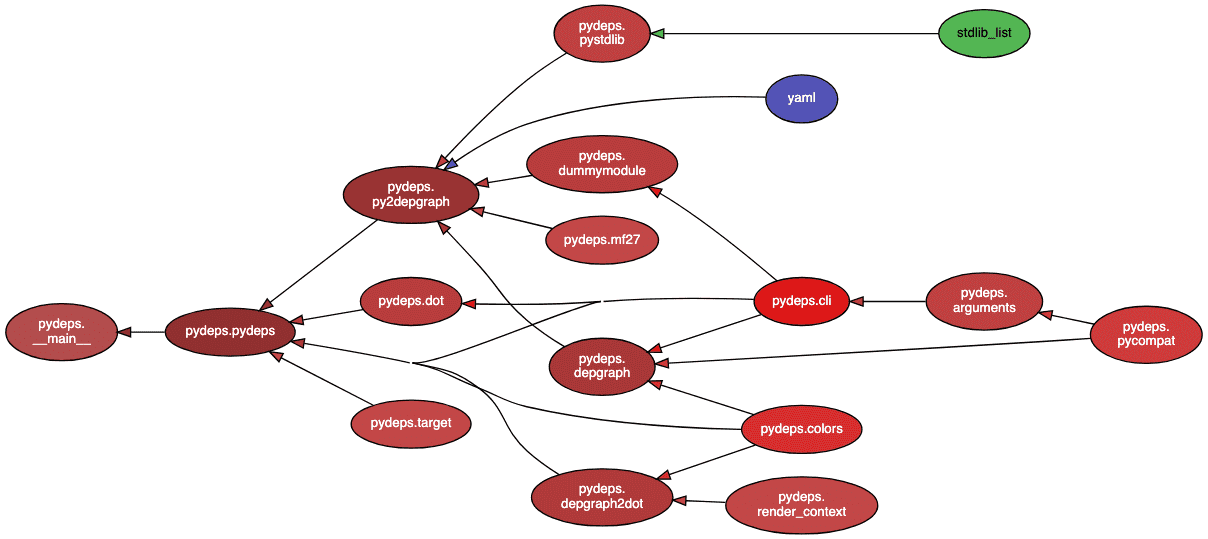
--collapse-target-cluster 对比,理解 --collapse-target-cluster 选项的作用—collapse-target-cluster
- 当内部目标包依赖项不重要时,可以使用 —collapse-target-cluster 标志折叠它们
- 把内部依赖包看成一个整体
- This option also implies
--cluster
shell> pydeps pydeps --collapse-target-cluster
其他
常用选项:
-x/--exclude-exact: 排除module列表
    -x PATTERN [PATTERN ...]
    or
    --exclude PATTERN [PATTERN ...]
    示例:
    shell> pydeps pandas --max-module-depth=2 -x pandas._\* pandas.test\* pandas.conftest

-xx/--exclude-exact:
    示例:
    -xx foo.bar will exclude foo.bar, but not foo.bar.blob

--only MODULE_PATH [MODULE_PATH ...]
    only include modules that start with MODULE_PATH

--pylib               include python std lib modules
--pylib-all           include python all std lib modules (incl. C modules)
使用技巧:
指定主要模块/包
pydeps /path/to/your/project/main_module.py

排除不必要的依赖: 限制生成的依赖层数,只显示最多n层的依赖
pydeps --max-bacon=2 /path/to/your/project
实战
metaGPT:
pydeps --max-bacon=2 ./metagpt/roles/product_manager.py
pydeps --max-bacon=2 ./metagpt/actions/action.py
...
llama_agent:
# 生成依赖图
pydeps  --max-bacon=5  --collapse-target-cluster  ./llama_agents

# 生成内部详细、外部cluster图
➜ pydeps  --max-bacon=2  --cluster  ./llama_agents
llama_index:
pydeps  --max-bacon=2  --collapse-target-cluster  ./llama-index-core/llama_index/core/

pydeps  --max-bacon=2  --cluster  ./llama-index-core/llama_index/core/
pipdeptree-依赖分析
- pipdeptree 是一个用于生成 已安装 Python 包及其依赖关系 的树状图的工具。
- 它可以帮助开发者直观地查看项目中所有包及其依赖关系,便于管理和解决依赖冲突。
- A command line utility to display dependency tree of the installed Python packages
- GitHub: https://github.com/tox-dev/pipdeptree
- https://pypi.org/project/pipdeptree/
主要特点:
显示依赖树:pipdeptree 以树状结构显示所有已安装包及其依赖关系,清晰地展示包之间的层次关系。
可选输出格式:支持多种输出格式,包括纯文本和 JSON 格式,便于进一步处理和集成。
过滤选项:提供多种过滤选项,可以选择显示特定包及其依赖关系,或者排除不需要的包。
检查依赖冲突:帮助检测和解决依赖冲突问题,确保项目中的包版本兼容。
安装:
pip install pipdeptree
使用方法:
# 生成并显示当前环境中所有包的依赖树
pipdeptree

# 生成 JSON 输出
pipdeptree --json

# 排除特定包
pipdeptree --exclude setuptools,pip
pipdeptree --exclude jupyter --exclude langchain
直接生成文件:
格式:
    --graph-output FMT
FMT包括:
    dot, jpeg, pdf, png, svg

1. 生成svg文件
pipdeptree --graph-output svg > aa2.svg

2. 生成png文件
pipdeptree --graph-output png > aa2.png
缺点:
仅限已安装包:只能显示当前环境中已安装的包的依赖关系,不能直接解析项目中的依赖文件(如 requirements.txt)。
复杂项目中的性能:对于依赖关系非常复杂的大型项目,生成的依赖树可能比较庞大和复杂。
示例
指定特定包:
$ pipdeptree --packages requests
requests==2.32.2
├── certifi [required: >=2017.4.17, installed: 2023.7.22]
├── charset-normalizer [required: >=2,<4, installed: 3.1.0]
├── idna [required: >=2.5,<4, installed: 3.4]
└── urllib3 [required: >=1.21.1,<3, installed: 1.26.15]
Pyan3-Offline call graph generator
- GitHub: https://github.com/davidfraser/pyan
- pyan is a Python module that performs static analysis of Python code to determine a call dependency graph between functions and methods.
- This is different from running the code and seeing which functions are called and how often; there are various tools that will generate a call graph in that way, usually using debugger or profiling trace hooks, such as
Python Call Graph. - In Pyan3, the analyzer was ported from compiler (good riddance) to a combination of ast and symtable, and slightly extended.
安装:
pip install pyan3

# 上面安装如何报错的话,可以使用这个命令
pip install --user git+https://github.com/kuuurt/pyan.git
Usage
命令行:
# 先生成dot
pyan *.py --uses --no-defines --colored --grouped --annotated --dot > myuses.dot
dot -Tsvg myuses.dot > myuses.svg

# directly export as svg
pyan *.py --uses --no-defines --colored --grouped --annotated --svg > myuses.svg

// export as an interactive HTML
pyan *.py --uses --no-defines --colored --grouped --annotated --html > myuses.html
在代码里使用api:
import pyan
from IPython.display import HTML
HTML(pyan.create_callgraph(filenames="**/*.py", format="html"))
选项:
--colored: 带有彩色标记的调用图
优化使用
指定特定的模块或函数:
pyan my_script.py module1 module2 --dot > output.dot
限制分析的深度:
pyan my_script.py --depth=2 --dot > output.dot
排除第三方库或系统库:
pyan my_script.py --no-thirdparty --dot > output.dot
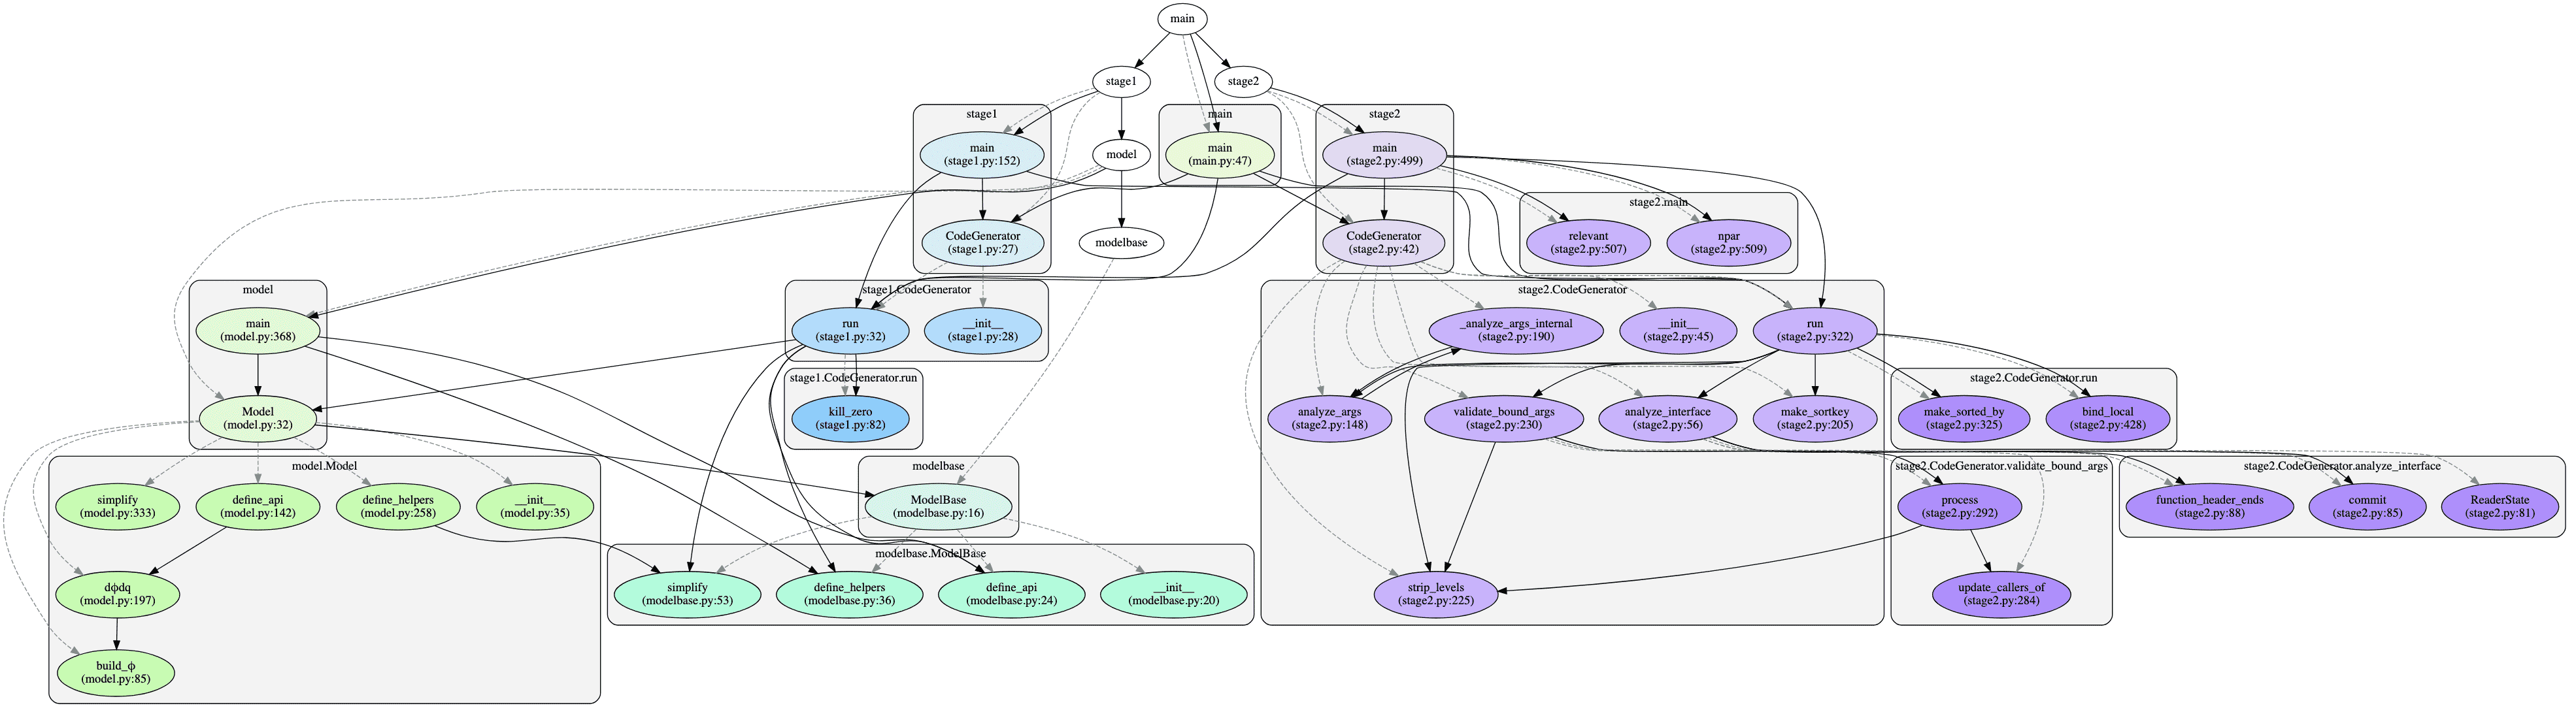
实战
metaGPT:
pyan3 ${PWD}/software_company.py --uses --no-defines --colored --grouped --annotated --svg --root ${PWD} > myuses.svg
Python Call Graph
- Python Call Graph is a Python module that creates call graph visualizations for Python applications.
- 官网: https://lewiscowles1986.github.io/py-call-graph/
- GitHub: https://github.com/Lewiscowles1986/py-call-graph
- Pypi: https://pypi.org/project/python-call-graph/
安装:
pip install python-call-graph
Note
详细使用参见: demo-python
参数
General Arguments:
-d, --debug
    Turns on debug mode which will print out debugging information.

-ng, --no-groups
    Do not group modules in the results.
    By default this is turned on and will visually group together methods of the same module.
    The technique of grouping does rely on the type of output used.

-s, --stdlib
    When running a trace, also include the Python standard library.

-m, --memory
    An experimental option which includes memory tracking in the trace.

-t, --threaded
    An experimental option which processes the trace in another thread.
    This may or may not be faster.
Filtering Arguments:
-i, --include <pattern>
    Wildcard pattern of modules to include in the output.
    You can have multiple include arguments.

-e, --exclude <pattern>
    Wildcard pattern of modules to exclude in the output.
    You can have multiple include arguments.

--include-pycallgraph
    By default pycallgraph filters itself out of the trace.
    Enabling this will include pycallgraph in the trace.

--max-depth
    Maximum stack depth to trace.
    Any calls made past this stack depth are not included in the trace.
实例
示例:
# Create a call graph image called pycallgraph.png on myprogram.py:
pycallgraph graphviz -- ./myprogram.py

# Create a call graph of a standard Python installation script with command line parameters:
pycallgraph graphviz --output-file=setup.png -- setup.py --dry-run install

# Run Django’s manage.py script, but since there are many calls within Django, and will cause a massively sized generated image,
# we can filter it to only trace the core Django modules:

pycallgraph -v --stdlib --include "django.core.*" graphviz -- ./manage.py syncdb --noinput
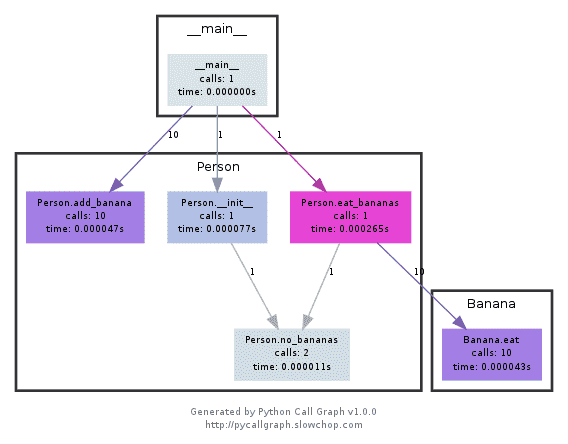
示例1-使用api
./files/demo1.py
执行:
python demo1.py
# 即生成如下图形
示例2-使用命令
./files/demo2.py
执行:
pycallgraph graphviz -- ./demo2.py